Author: John Fletcher, Technical Support Manager
Related Product(s)>>
>>Download Full PDF
Abstract
Many modern electronic gauges have the capability for transmitting or uploading data to a computer via a data port. This can mean transferring the data to a spreadsheet for customized analysis or to a
data management software package for analysis using standard statistical methods.
This paper describes the format of the data for a range of gauges used for the coating inspection
process including surface profile determination, climatic condition monitoring and coating
thickness measurement.
Introduction
One attribute of electronic measuring equipment that has the capacity to improve decision making
in the inspection environment is the potential to upload readings either directly, as they are taken, or
from the gauge memory. Not all electronic gauges have this feature but where it exists, the
management of data is made much easier and more accurate than using manual methods.
The electronic management of data allows records to be accurately transferred for decision-making
and for further analysis to assess cause and effect within the process. The traditional method of
pencil and paper is prone to error and is time consuming. In addition the calculating power of
modern gauges and portable computers makes electronic transfer of data a powerful tool for
archiving, for process control and decision-making and for formal reporting to clients and other
interested parties.
RS 232 is a standard for binary data interconnection between data terminal equipment, in this case a
gauge used for relevant measurements during a coating process, and data communication
equipment, computers or printers. RS 232 has been commonly used in computer serial ports
although many new computers, particularly laptops, use the USB, Universal Serial Bus. Many
gauges used in the process of applying protective coatings have RS 232 data output and there are
reliable adapters to convert the RS 232 output to a USB computer input.
Electronic gauges that have data output features include ultrasonic thickness gauges, Dewmeters,
coating thickness gauges, adhesion testers and Glossmeters. Many of these gauges also have on-board
memory that can store readings in batches until the User has opportunity to upload the
content of the memory to either a printer or a computer. It is also possible to use data-loggers to
transfer data from a gauge transducer to either a printer or a computer particularly if a hostile
environment is involved such as high temperatures in a cure oven.
This paper will describe some of the data transfer and data analysis, storage and presentation
methods used in gauges that are used for the inspection of coatings and coating processes, using
some of the proprietary software to illustrate the capability.
Data Storage vs. Data Transmission
In the field of dimensional metrology it is quite common for electronic gauges to be designed so
that each reading is automatically transmitted to data communication equipment as part of the
measurement process. This allows the data to be assessed in real time and allows for on-line
measurement of manufacturing processes. An example of this is dial gauges on a fixture to measure pipe diameters on automotive fuel line assembly.
However, in the case of inspection equipment for coatings it is more common for the gauges to have
on-board memory so that groups, sets or batches of readings can be taken and stored in the memory
until they can be uploaded to a computer or printer.However, in the case of inspection equipment for coatings it is more common for the gauges to have
on-board memory so that groups, sets or batches of readings can be taken and stored in the memory
until they can be uploaded to a computer or printer.
Printers are the simplest form of data management, as a preset copy of the values can be generated
within the firmware of the gauge. This can be a summary of the batch information, including the
number of readings, the average, highest and lowest values and statistical values such as the
standard deviation and the coefficient of variation. Or it can be a complete list of values with tags
where high and low limits are invoked and a rudimentary histogram to illustrate the spread of
readings around the calculated mean.
The use of on board memory makes coating inspection gauges easier to carry and use in the field,
while retaining the capacity to handle data electronically for archiving, analysis or reporting. Such
gauges have typically utilised cable communication to the data communication equipment although
wireless communication is becoming more common.
Where coatings are applied in a paint shop, gauges may be permanently connected to the computer
or data logger and in such cases a group of gauges can be connected together using a multiplexer so
that only one connection is required to the computer.
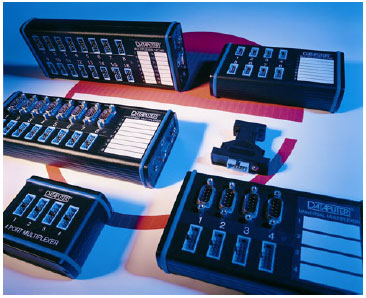
Multiplexers with one, four, eight and sixteen channels
The gauges are connected to the RS 232 ports on the multiplexer and the output is then connected to
the computer. The computer can then control the flow of data from the various gauges using the
data transfer software to input readings to a spreadsheet by rows or by columns to build up a data
set for further computation and analysis. This approach eliminates errors that occur when data is
collected manually due to misreading or miscopying.
Data Uploads To Spreadsheets
For an individual gauge data can be uploaded from the memory of the gauge to a spreadsheet
running on a computer using the transfer software program. This Windows-style program
runs in background on the computer and can be set up to send readings to a spreadsheet as a column
of values, stripping unwanted information in the data string such as leading or trailing zeros, or text
such as unit symbols so that just the numeric value for the reading is placed in the spreadsheet cell.

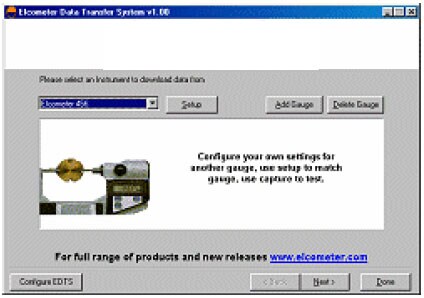
Gauge Selection Screen Showing Dewmeter
When a gauge is selected, an operations wizard is activated to take the user through the steps to
upload data from the gauge to the spreadsheet. When the readings have been uploaded in to the
cells, the calculating and presentation features of the spreadsheet can be used to analyse the data,
calculate statistics and produce charts, as required by the work in hand.
Several gauges used for coating inspection are configured for data transfer and the User can select
from this list for simplicity. The setup includes the appropriate RS 232 protocol including the data
transfer rate, e.g. number of data bits, no of stop bits, parity, hand shaking and baud rate (19200
baud). In addition, other gauges with serial data output can be configured to upload readings in to a
spreadsheet utilising the gauge setup feature. This also allows the data string sent by the gauge to be
filtered so that just the numeric value of the reading is entered in the cell.
Gauge Configuration Screen
For Unlisted Gauges With Serial Data Output
Once a gauge has been configured in this way it is added to the list of gauge options for further use.
It is possible to construct a job record so that the reading number corresponds to a location on the
job and the value in the cell can then be related to similar cells to drill down and present
information from particular areas. For example for a coating thickness survey it is possible to
designate the first batch to be the thickness of the galvanised layer, the second batch to be the
primer thickness readings, the third batch to be the coat and the fourth batch to be the topcoat. If the readings are taken at the same points on the structure each time the spreadsheet can be used to
calculate the individual layer thicknesses by subtraction, i.e. the thickness of the topcoat is batch 4
minus batch 3.
Alternatively, for thickness readings on an I-beam, readings 1 – 10 are taken on the web, 11 – 20 on
the upper flange and 21 – 30 on the lower flange, etc. so that each group can be separated and the
average, standard deviation, highest, lowest and range of readings can be calculated and presented
using the spreadsheet features.
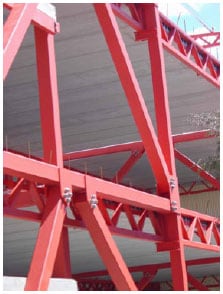
Typical Steel Structure Where Analysis
Can Be Enhanced By Location Information
This form of analysis can be used to fulfil the requirements of testing methods such as those
described in PA2 or ISO 19840, where there is a defined number of readings for an inspection area,
where the use of the coating thickness gauge is defined and the acceptance and rejection criteria are
identified against a target value.
Data Management Software
When data is collected in batches, the analysis and presentation can be enhanced by the use of data
management software. Readings can be collected in a gauge remote from the computer and then
uploaded as a batch or batches for archiving, analysis and presentation.
The data management software has a number of gauge transfer options pre-programmed to simplify
the transfer of data in to the database and there are a number of database management features to
allow, for example, batches to be combined and notes to be added to make the information more
meaningful when further analysis is carried out.
There are a number of charts that can be displayed to present the data. For example, the Run Chart
shows all the readings in a batch in sequence so that trends can easily be seen. A histogram can be
calculated and presented with a normal distribution superimposed so that the spread of data values
can easily compared to the target values and upper and lower limits. A lognormal chart can be used
to determine how much variation there is in the data set from the statistical normal distribution, to
determine the degree of control exhibited by the coating process.
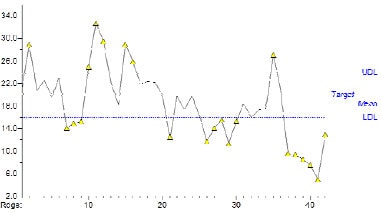
Run Chart Print Format
Some specialized charts exist for the analysis of coating thickness data such as the 80/20 Chart. This
chart can be set up so that the specified coating thickness is equal to the Lower Drawing Limit and
then the 80% of target value becomes the lower specification limit and the 120% of target value
becomes the upper specification limit. The chart then presents the data relative to these values as
required for assessment either to SSPC PA-2 or to ISO 19840.
Data uploaded to the data management software can be edited but the program records the edit
so that fabrication of data to pass or fail inspection criteria is not possible. Values and limits can be
changed on a “what if” basis so that the effects of the changes can be seen. However, the batch
record will carry the note (Edited) so that the change is visible.
Databases can be managed through the program so that batches of readings can be moved to
existing folders or new folders created from within the program to simplify the archiving of data
for future reference.
Coating Inspection Gauges With Data Output
In general, the data output for electronic gauges used in coating inspection are relatively simple.
However there are different forms of data depending on the type of gauge being used and the
readings that are stored within the gauge. For example, coating thickness gauges can be set up in
counted average mode where the gauge stores only the average of a pre-set number of readings.
This is useful for analysis in the SSPC PA-2 method but it may be preferred to collect the data as a
series of individual readings and assess each spot reading in subsequent analysis. In this way the
effect of individual values outside acceptable limits can be seen.
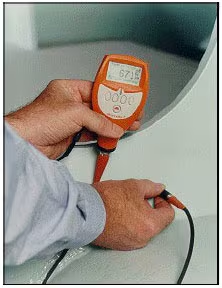
A Coating Thickness Gauge
Collecting Readings on a Steel Fabrication
It should be noted that the data output for direct printing is often different to that for data
management by computer or data logger in that the printer formatting and text strings are included
in the output for a printer but just the readings with some batch identification are transmitted to a
computer. ASCII format is commonly used for printing and EPSOM compatible character codes
make it possible for a range of serial printers to be used.
The availability of portable serial printers in the market is now in decline, as most portable printers
are now used with laptop computers and these utilize parallel connections or, more typically these
days, USB. This has promoted the use of computer based data management solutions with software
packages to simplify both the transfer of data from the gauges and the handling of the data on the
computer.
Gauges with infrared data output tend to be limited to communication with specific infrared printers
as there is no infrared communication standard for computers and the infrared output for coating
thickness and relative humidity gauges is often specific to one type of printer.
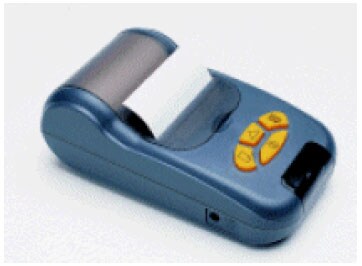
Infrared Printer For Line of Sight Use with
Coating Thickness, Dewmeter and Cure Oven Data Logger
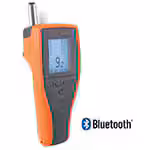
In some cases the data transmitted by a gauge is application specific. For example the Dewmeter
transmits a data set comprising, the values for relative humidity, air temperature, surface
temperature, the calculated dewpoint temperature, the calculated difference between the surface and
dewpoint temperatures (ΔT) and the date and time of the readings. This data set is transmitted
together and a batch of readings would contain each of these values for each set in the batch.
A Glossmeter stores individual Gloss values if a single angle gloss measurement is taken. Multiple
values are stored when a dual or triple angle Glossmeter is used, i.e. a reading for the 20° optics, a
reading for the 60° optics and a reading for the 85° optics.
In contrast, the ultrasonic material thickness gauge sends just the thickness values in groups
(batches).
Report Formats
Reporting of the data used to arrive at conclusions about a process or for decision-making for future
work is a vital part of the measurement method. Electronic data management offers the possibility
of the inclusion of summaries of the data, charts illustrating the data or even the full data set in
support of the results.
Reports generated electronically can make use of the exporting feature of the software to transfer a
text format version of the data to another application such as word processing. Charts can be transferred using the computer clipboard feature and in the case of EDCS+ there is a report writing
function that allows the report to be customised to include a company logo, photographs of the
work area and summary data that can be presented as a complete report to a client, either as an
electronic file or as a hardcopy print.
Templates can be created or the existing template can be used to make this process simple and
repeatable for consistency.
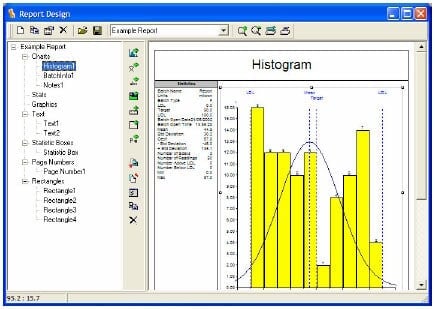
Screen View of Chart Report Page
Showing Histogram Chart and Statistical Summary
Conclusions
The benefits that accrue from the electronic management of reading data produced by gauges used
for the measurement of coating processes are very significant. Basic errors are reduced, as there is
no possibility of mistakes in the transcription of the readings from the display to the record. The
calculating power of the computer can be brought to bear on the data to determine process
capability, trends in performance and to identify areas of concern.
However, it is important to recognize that data has to be collected in a manner appropriate to the
analysis and it is therefore important to recognize the capability of the measurement method and the
limitations of the data set when drawing conclusions.
Electronic data management does not substitute for adequate process control it simply makes it
possible to quickly establish the result of measuring particular attributes of the process such as
surface profile, climatic conditions, substrate thickness, coating thickness, gloss and others.
Finally the electronic data format lends itself to archiving and retrieval so that future investigations
are more easily made and progress in the control of coating processes can be maintained, leading to
better and more cost effective protective coatings.
Related Product(s)
Download Full PDF |