 Author: John Fletcher, Technical Support Manager
Related Product(s)>>
>>Download Full PDF
ABSTRACT
The measurement of climatic conditions prior to applying a coating is vital to the success of the process, as it is well known that a surface at the dewpoint temperature will have a thin film of moisture over which the paint will be applied. If the surface temperature is within 5 °F (3 °C) of the dewpoint temperature there is a probability of the presence of moisture due to the uncertainty of the measuring devices and the inertia of the
surface during warming.
It is therefore essential that the relative humidity (RH), the air temperature (Ta) and the surface temperature (Ts) are measured quickly and accurately so that the dewpoint temperature (Td) and the difference between the surface and dewpoint temperatures can be calculated for correct paint or not paint decisions to be made. This paper describes the latest design and operational features of a digital dewpoint meter and describes how this gauge is calibrated and used for both quality control of paint application processes and for monitoring cure conditions using data logging techniques.
INTRODUCTION

Figure 1 – Magnetic Bimetallic Strip Thermometer and Bacharach Sling Hygrometer
It is critical to the service life of a protective coating system that the coating is applied to a clean, dry surface, in order to ensure that contamination is not trapped within the system either between the primer coating and the substrate or between subsequent layers that make up the full protective system. If contamination is present it can lead to the formation of a corrosion cell and to premature failure of the coating.
The method for determining if moisture is present is given in ISO 8502-4:2000 Preparation of steel substrates before application of paints and related products -- Tests for the assessment of surface cleanliness - Part 4: Guidance on the estimation of the probability of condensation prior to paint application. The method specified is based on measuring air temperature and relative humidity, calculating the dewpoint temperature, measuring the steel surface temperature, and estimating the minimum surface temperature (above the dewpoint temperature) that is needed to avoid condensation under the prevailing environmental conditions.
For many years it has been standard practice to measure the climatic conditions before applying protective paints to ensure that the temperature of the surface to be painted is at least 5 °F (3 °C) above the Dewpoint Temperature for the ambient conditions under which the coating is to be applied. By this method, Contractors and Inspectors can ensure that moisture is not condensing on the surface to be coated from the surrounding atmosphere. These temperatures make allowance for the accuracy of the measurement of relative humidity and surface temperature in the field and also deal with any inertia in the evaporation from a surface as it warms up.
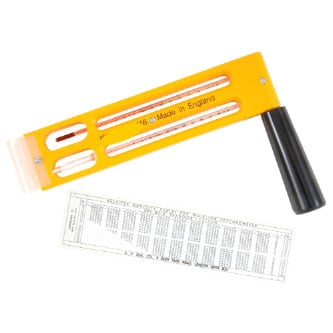
Figure 2 – Wet and Dry Bulb Whirling Hygrometer With Relative Humidity Calculator
Parsons and Swani deal with these and other issues associated with the measurement of relative humidity in their paper “Accuracy and Linearity of Sling and Digital Psychrometers.
The definition of the Dewpoint Temperature is the temperature at which moisture will condense from a body of air at a higher temperature. The value of the Dewpoint Temperature mainly depends on the Relative Humidity of the air, that is the volume of moisture contained in the air at a given temperature compared to the maximum volume of moisture that this volume of air could contain if it were saturated at that temperature.
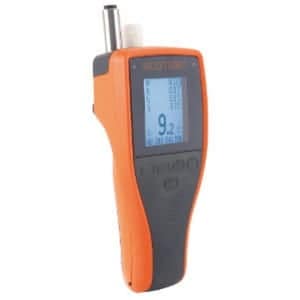
Figure 3 – Digital Electronic Dewpoint Meter
It can clearly be seen that if a surface is cooled sufficiently the surrounding air will eventually give up its moisture to the cool surface. This is shown daily in the layer of moisture that collects on a cold windowpane in the presence of boiling water or, more interestingly, on the outside of a glass of cold beer.
The method for determining the Relative Humidity and hence the Dewpoint Temperature that has been most commonly taught to Paint Inspectors is the Wet and Dry Bulb method, commonly called the Whirling or Sling Hygrometer. The Dewpoint Temperature is then compared to the temperature of the surface to be painted determined by another measurement, sometimes using a magnetic bi-metallic strip thermometer. Examples of these measurement devices are shown in figures 1 and 2 below.
The use of the sling hygrometer or whirling hygrometer is described in ASTM E337 – 02 (2007), Standard Test Method for Measuring Humidity with a Psychrometer (the Measurement of Wet- and Dry-Bulb Temperatures). However, the hygrometers described in this method use mercury in glass thermometers, which are no longer acceptable under Restriction of Hazardous Substances (RoHS) legislation round the world.
It is now possible to determine the ambient climatic conditions using a rugged electronic gauge that contains all the functionality to make the “paint or don’t paint” decision accurately and very quickly in a single gauge. An example of this type of gauges is shown in figure 3.
The Digital Electronic Dewpoint Meter is described in BS EN ISO 8502-4 as digital electronic hygrometers based on measurement of capacitance change of polymer films.
THE DIGITAL ELECTRONIC DEWPOINT METER
Digital humidity gauges have been available for some years but there is now a Dewpoint Meter that is designed specifically to monitor the paint process and that also provides a method for recording and presenting data as proof of the conditions prevailing.
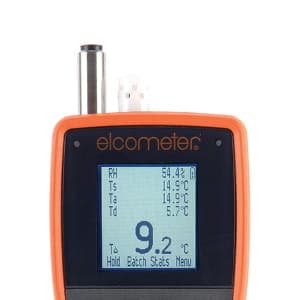
Figure 4 Electronic Dewmeter Display Showing the RH, Ts, Ta, TD and TΔ Values on screen together
The Digital Electronic Dewpoint Meter measures relative humidity (RH), air temperature (Ta) and surface temperature (Ts). Using the rh and air temperature, the gauge calculates the dewpoint temperature (Td) and then calculates the difference between the dewpoint temperature and the surface temperature (TΔ) and assess this difference against the 5 °F (3 °C) threshold that is used to determine if it is safe to paint.
A semiconductor sensor is used to measure the relative humidity so the measurement response time is much quicker than the traditional wet and dry bulb method that can take 20 minutes or more to reach steady-state conditions, at which point the temperatures of the bulbs can be read. This is particularly the case when the hygrometer has been stored in office conditions and then is used outdoors in different conditions of temperature and humidity. Even when an Electronic Dewmeter is taken from a warm office or car to a cold environment, an accurate reading of rh can be obtained in less than 30 seconds.
The air temperature is measured using another semiconductor sensor mounted close to the RH sensor to minimize any differences in conditions. The output from this sensor is displayed as Ta. The surface temperature is measured either using an integrated K-type thermocouple sensor mounted next to the RH and Air Temperature sensors or by using an optional external thermocouple sensor connected via a K-Type connector. This sensor can be also be used for measuring the temperature of materials to be used in the process or for surface temperature monitoring during the process, data-logging. When an external thermocouple sensor is connected the integrated surface temperature sensor is disconnected from the gauge. (See figure 4).
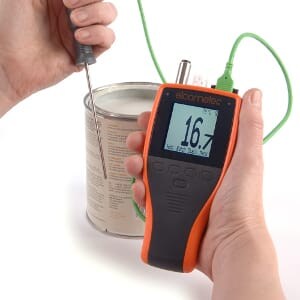
Figure 4 The Electronic Dewmeter with an external thermocouple sensor connected.
In some instances, test records for climatic condition monitoring require that the wet and dry bulb temperatures are entered into the record sheet so to make this process easier and quicker the Electronic Dewmeter provides estimates of the relevant wet and dry bulb temperatures based on the measurement of RH and Ta. The estimated values for the wet bulb temperature (Twb) and the dry bulb temperature (Tdb) can be displayed by selecting these parameters from the Display menu in preference to two of the usual set, e.g. Ta and TΔ. Note – Ta will be the same value as Tdb.
The digital format of the gauge allows sets of reading to be stored in memory for further analysis, reporting or archiving. Each set of readings consists of an RH value, the corresponding air temperature, surface temperature and the calculated Dewpoint Temperature and temperature difference, together with the estimated values for wet bulb and dry bulb temperatures.
The memory capacity is a maximum of 25,000 records or sets, in up to 999 different batches. Data can be collected either on command by pressing “HOLD” or using the preset interval data-logging feature. The preset interval can be adjusted from 1 second to 1 hour.
High limits and low limits can be set for each of the climatic parameters; RH, Ta, Ts and Td. High and low limits can also be set for TΔ but a default low limit of 3.0 °C is preset in Celsius units with an equivalent of 5.4 °F in Fahrenheit units. When set and activated by setting the high or low limit on in the “LIMITS” menu, the gauge gives audible and visual warnings when a limit is exceeded.
The display also indicates trends for the values on the screen; with the ▲ symbol indicating an increasing trend fro the value and the ▼ symbol indicating a decreasing trend.
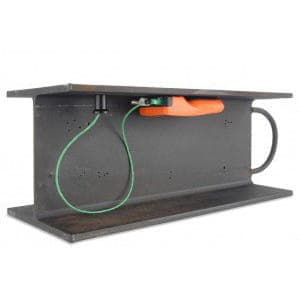
Figure 5 – Dewpoint Meter Configured for Data-Logging
Data can be recorded using two methods, user activated recording of values as and when required or the data-logging mode, with reading sets recorded automatically at the end of the pre-set interval. In the datalogging mode the gauge is attached to the steel substrate by three strong magnets mounted in the back of the gauge case. The external thermocouple is also attached to the substrate using a magnet to get a good thermal contact for the surface temperature measurement. This arrangement is shown in figure 5.
The User operates the manual data collection mode by creating a new batch or entering an existing batch using the manual logging batch option and pressing the “HOLD” softkey. The options to “Save” or “Escape” (Esc) will be displayed.
Similarly the data-logging option can be chosen when a new batch is selected by pressing the clock softkey. Adjusting the logging interval can be done via the screen shown when interval logging is first selected. The default time is 1 minute.
Once data has been collected either in manual or data-logging time interval mode the statistical analysis of the reading sets can be viewed on screen where the number of readings, the mean, the standard deviation, the coefficient of variation (the standard deviation as a percentage of the mean) the highest and lowest readings are displayed with a page for each climatic parameter, RH, Ts, Ta, Td, TΔ, Tdb and Twb, in order.
Data stored in the memory of the Dewpoint Meter can be transferred to a computer operating data management software. There are two methods for transferring data, via a USB cable or wirelessly using Bluetooth®. The wireless connection will operate over a distance of up to 15 m.
The proprietary suite of software programs is the cornerstone of the paperless data management system and within this suite of programs there is a Mobile software application allowing readings to be sent directly to data devices such as PDAs & mobile phones by the gauge making remote communication easier. The PC
version of the software also offers features for analyzing data, for reporting and for archiving date for future analysis or comparison.
CALIBRATION
Calibration of the Electronic Dewpoint Meter is carried out in a temperature controlled humidity chamber, whereas the calibration of the wet and dry bulb hygrometers is limited to assessing the accuracy of the spirit in glass thermometers. Measurement of relative humidity in controlled conditions is not practical for the whirling or sling hygrometer as the presence of an operator in the controlled environment causes errors. The Electronic Dewpoint Meters can be placed in the humidity chamber and the measurements monitored using the data output feature to achieve calibration against another relative humidity gauge that is separately calibrated for trace-ability.
| Table 1 – Typical Calibration Values for Calibration Certificates |
|---|
| Test Parameter | Units | Typical Reference Value | Tolerance |
|---|
| RH Low | %RH | 43.59 | ±3.00 |
| Ta Low | °C(°F) | 15.32(59.6) | ±0.50(.9) |
| RH High | %RH | 68.84 | ±3.00 |
| Ta High | °C(°F) | 35.26(95.5) | ±0.50(.9) |
| Ts Low | °C(°F) | 15.26(59.6) | ±0.50(.9) |
| Ts High | °C(°F) | 34.71(94.5) | ±0.50(.9) |
| External Probe T1 | °C(°F) | -40.00(-40.0) | ±0.50(.9) |
| External Probe T2 | °C(°F) | 30.00(86.0) | ±0.50(.9) |
| External Probe T3 | °C(°F) | 100.00(212.0) | ±0.50(.9) |
| External Probe T4 | °C(°F) | 200.00(392.0) | ±0.50(.9) |
To simulate the practical operation of the Dewmeter, the calibration is carried out at low and high values of
RH, with low and high values of Ta. Surface temperature measurements are also made at low and high
values and the external temperature measurement is checked at four values across the range. Nominal values
of 45% and 70% RH with nominal temperatures of 15 and 35 °C have been chosen for the chamber
conditions, with four values for the external temperature measurement from –40 to +200 °C. Table 1 shows
the typical measured reference values for these parameters that appear on the calibration certificate.
The reference values are set using the controls for the chamber and measured independently using calibrated
equipment. The RH and Air Temperature values in the chamber are measured using a Hydroclip2 gauge. The
surface temperature is created using an ISOTECH TTI-7 surface temperature plate and a Beamex MC5
thermocouple voltage calibrator is used to test the external temperature measurement.
The values quoted in table 1 are obtained from the calibration software and can be shown to a resolution of
two decimal places. The Dewmeter gauge displays the parameters to one decimal place.
The practicality of field calibration checks using saturated salt solutions to provide reference values for RH
measurement is being investigated. A saturates salt solution of sodium chloride, for example, has a relative
humidity of 75% in the space above the saturated solution.
ACCURACY COMPARISONS
There are several operational aspects of the wet and dry bulb hygrometer method for measuring humidity that influence the accuracy of the measurement including insufficient whirling so steady-state conditions are not reached, contamination of the water so optimum evaporation conditions for the wet bulb are not achieved, the use of spirit-in-glass thermometer in place of the environmentally unsound mercury-in-glass thermometers.
In practice, some skill and experience is required to operate a whirling hygrometer successfully in the field and even so a studyii has shown that “with cautious measurement the sling hygrometer (psychrometer) yielded a ±4% error”.
These errors accumulate from a number of operational issues such as alignment of the lens in the glass thermometers for optimum position when reading both thermometers, parallax errors when reading the position of the thread relative to the scale on the glass, heat from hands transmitted to the bulbs of the thermometers and resolution of the measurement and the conversion of the readings to rh and dewpoint.
Using the electronic Dewmeter Gauges ensures that changes in the microclimate that can exist in enclosed areas can easily be recognized and the data-logging feature means that an accurate record for the duration of a process, either the application of the paint or the subsequent cure process, can be made. This can then be
assessed against the process requirements to ensure compliance.
The accuracy of the electronic measurements can be shown to be as indicated on the calibration certificate and the speed of response of the electronic gauge can show the effects of the presence of humans in the area, particularly if the area is enclosed or the effects of changes in a prevailing wind if the work place is exposed.
CONCLUSIONS
The traditional method of evaluating the climatic conditions for painting has significant limitations in practise due to the time taken to obtain readings and the potential errors of these readings.
The “paint/don’t paint” decision for the climatic conditions relies on the determination of the dewpoint temperature and the surface temperature and when painting crews are on bonus rates and the service life of the protective coating is measured in 10 of years, the pressure is on the paint inspector to get this analysis and the subsequent decision correct.
The advantages of the Electronic Dewpoint Meter are in the speed and accuracy of the measurement and in the traceability of the gauge calibration to a national standard. Due to the operation of the whirling or sling hygrometer it is not practical to use the humidity chamber method to check the performance of these types of hygrometers (psychrometers) so the calibration of these rely on the calibration of the thermometers alone. It must be recognized that Digital Dewmeter do have an uncertainty associated with the measurement and, as electronic gauges, they must be treated with care particularly when they are used on a construction site. This is also true for whirling and sling hygrometers as when these encounter immovable objects such as pillars the tendency is to break the spirit-in-glass thermometers.
The feature in the electronic Dewmeter that displays the calculated wet bulb temperature and the measured dry bulb temperature (the air temperature, Ta) has good agreement with the wet and dry bulb method in conditions of stable relative humidity. However, the extra resolution provided by the electronic gauge over that of the whirling and sling hygrometers is useful in reports.
Finally the electronic gauge lends itself to paperless data management system with one version of the gauge having Bluetooth® wireless communication capability over 15 m to allow batches of reading sets to be transferred to a PC for archiving, reporting and even for further analysis.
i Parsons Phillip K. and Swan Tom “Accuracy and Linearity of Sling and Digital Psychrometers”, PACE 2007 Conference Proceedings Disc
ii Waite, Ronald W., “Field Comparison between Sling Psychrometer and Meteorological Measuring Set AN/TMQ-22”, ARMY ELECTRONICS COMMAND WHITE SANDS MISSILE RANGE N MEX ATMOSPHERIC SCIENCES LAB, AUG 1971
Related Product(s)
Download Full PDF |